Depth, not price, told the truth this week
Three tests in one week: 316 midterm markets scored against the results, a jobs report that landed in the tail, and a CPI picture that has not moved in ten days. The same pattern ran through all three: how much money sits near a price told us more than the price did.
The midterms: how 316 markets scored
At 4pm Eastern on election day (21:00 UTC, 3 November) we froze every midterm market we record on Polymarket and Kalshi: 316 that have since resolved, from the House and Senate down to single districts and side bets. Then we scored each price against what happened.
The overall numbers: a Brier score of 0.093 (0 is perfect, 0.25 is what you get by pricing everything at 50%), 0.092 on Polymarket and 0.095 on Kalshi. The favourite won 85% of the time. That is respectable for a mixed bag of markets priced hours before the polls closed. What matters is how it varied.
The deeper the book, the better the call
We sorted the markets by how many contracts were resting within five cents of the price at 4pm. In the 150 markets with more than 100,000 contracts near the price, the favourite won 91% of the time. In the 118 with 10,000 to 100,000 it won 84%. In the 48 with fewer than 10,000 it won about 73%. The Brier scores line up: 0.067, then 0.102, then 0.116 to 0.163 for the thinnest two groups.
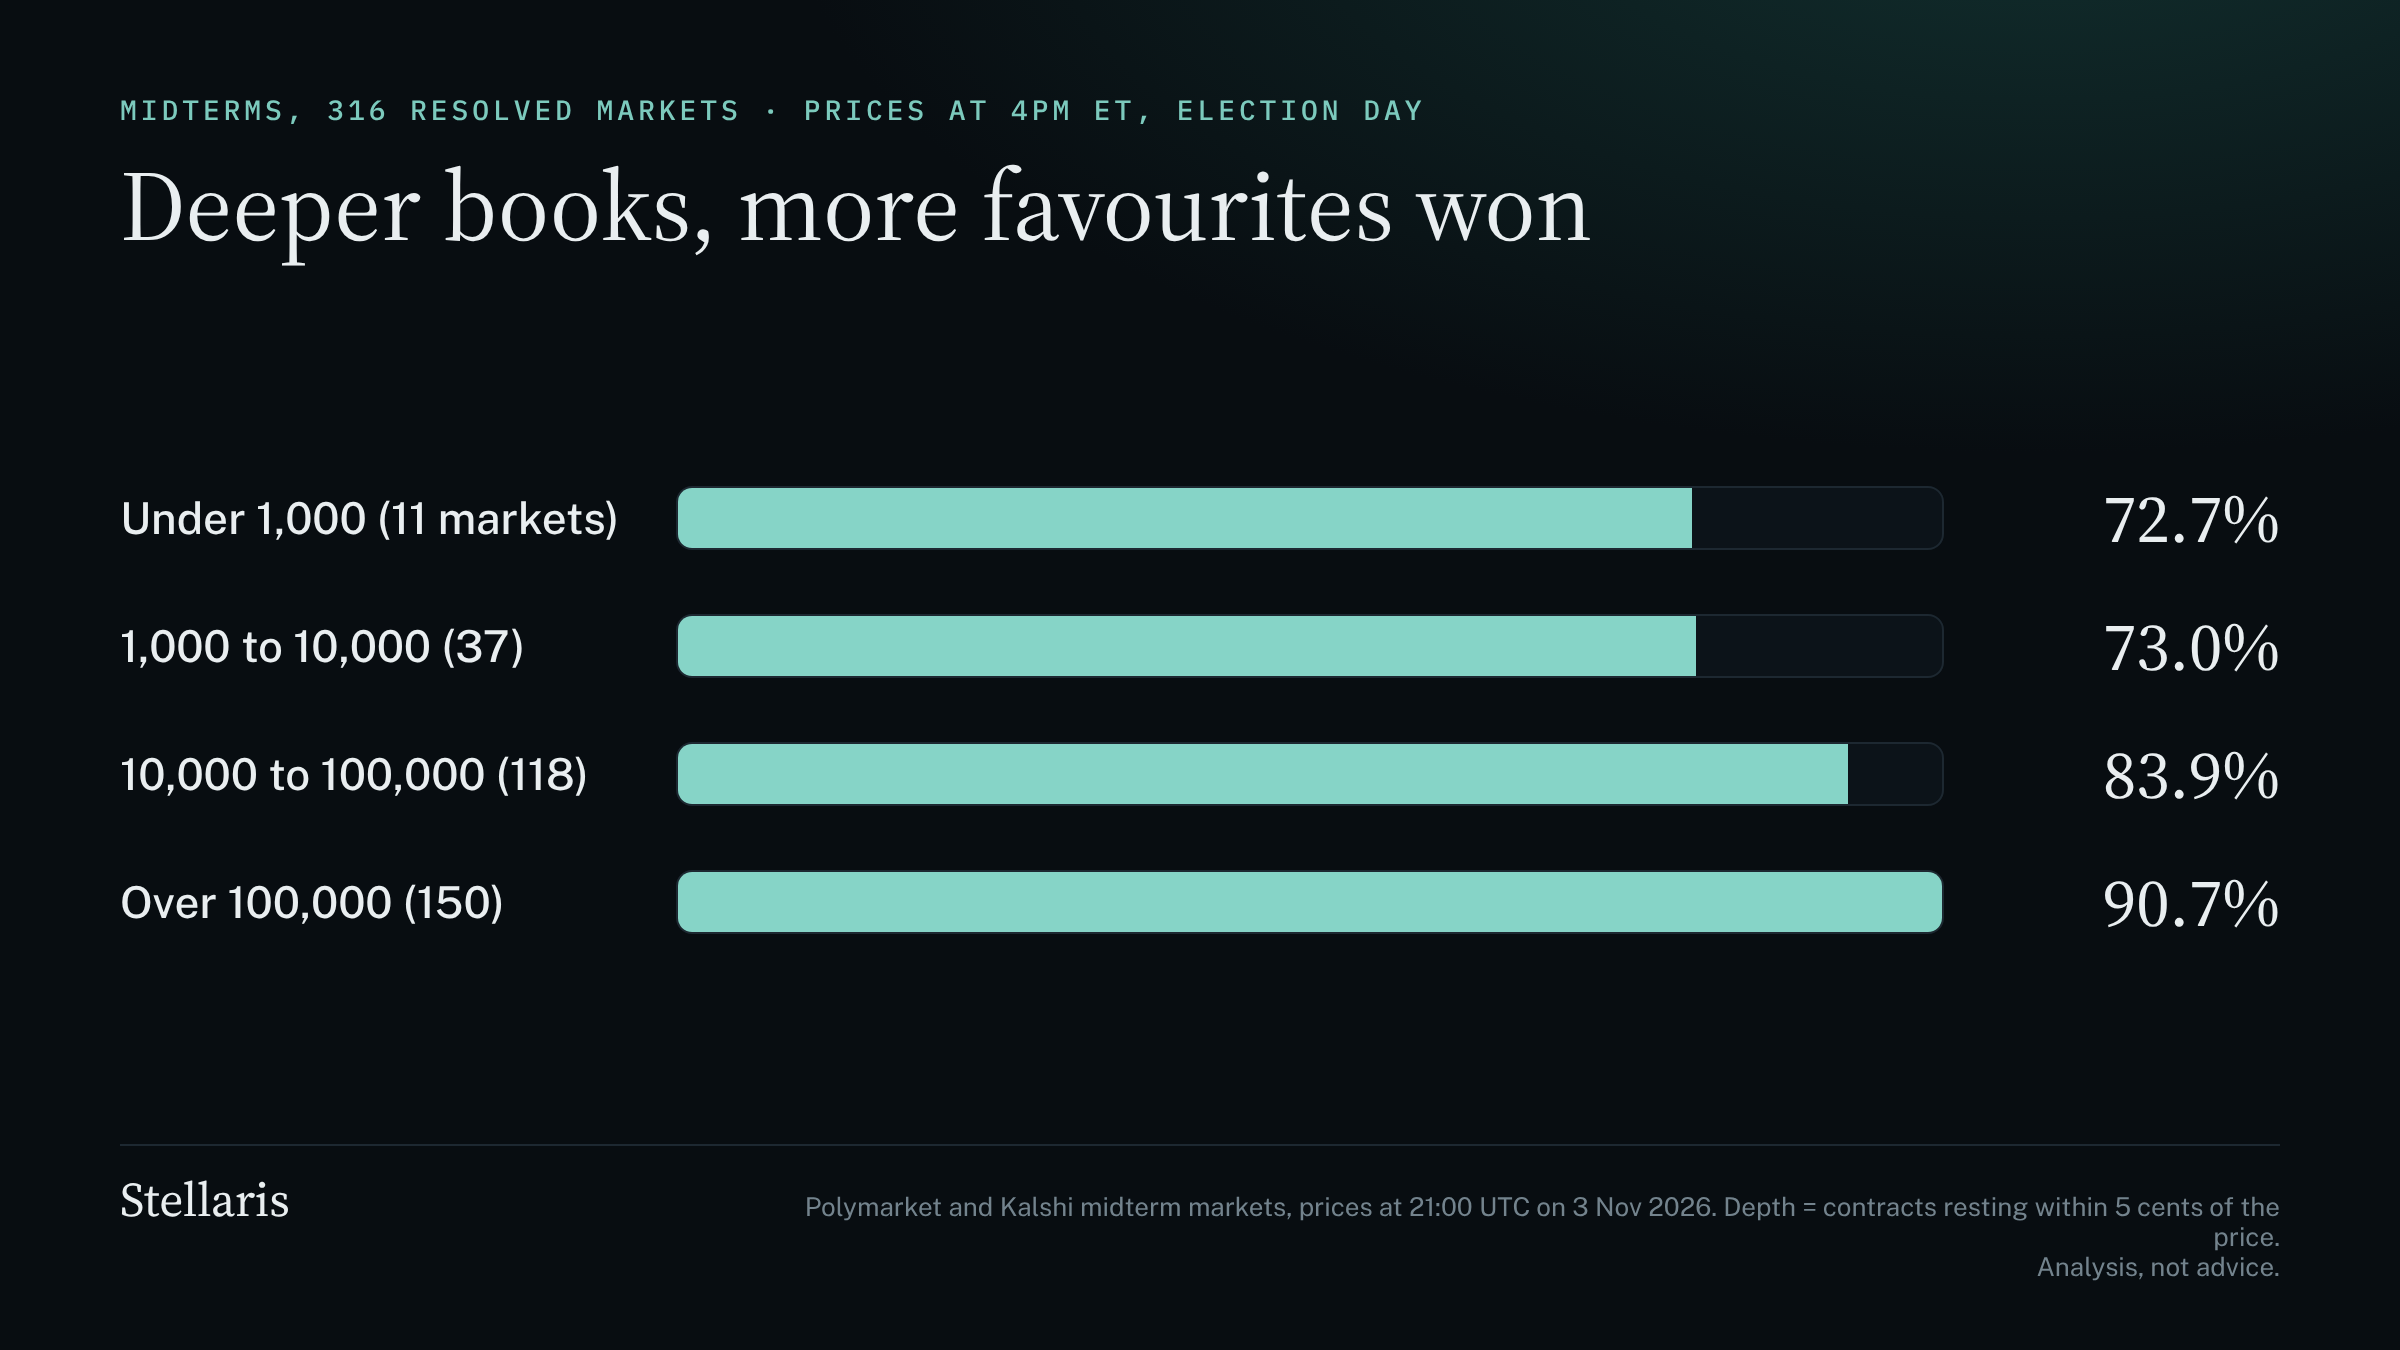
Two cautions. The deepest markets are mostly the national ones: favourites won about 93% of the time in the Senate and governor markets, against 73% in the House-seat markets, which are thinner and genuinely harder to call. So some of this is race type, not depth. Separating the two is the first thing we will do this week. And the thinnest group is only 11 markets.
The biggest misses all ran one way
The 15 largest misses, the cases where the favourite lost, cover nine different questions. Every one ran in the same direction: Democrats did better than the 4pm price implied. NC-06 was priced at 14% for the Democrats, NC-14 at 22%, IN-05 at 26%, OH-10 at 28%, the South Carolina Senate race at 30%, NC-09 at 36%, a Democratic win of both the Texas governor and Senate races at 36%, and a "blue mega-tsunami" market at 36%. A market on which party would win white voters had the Democrats at 12%.
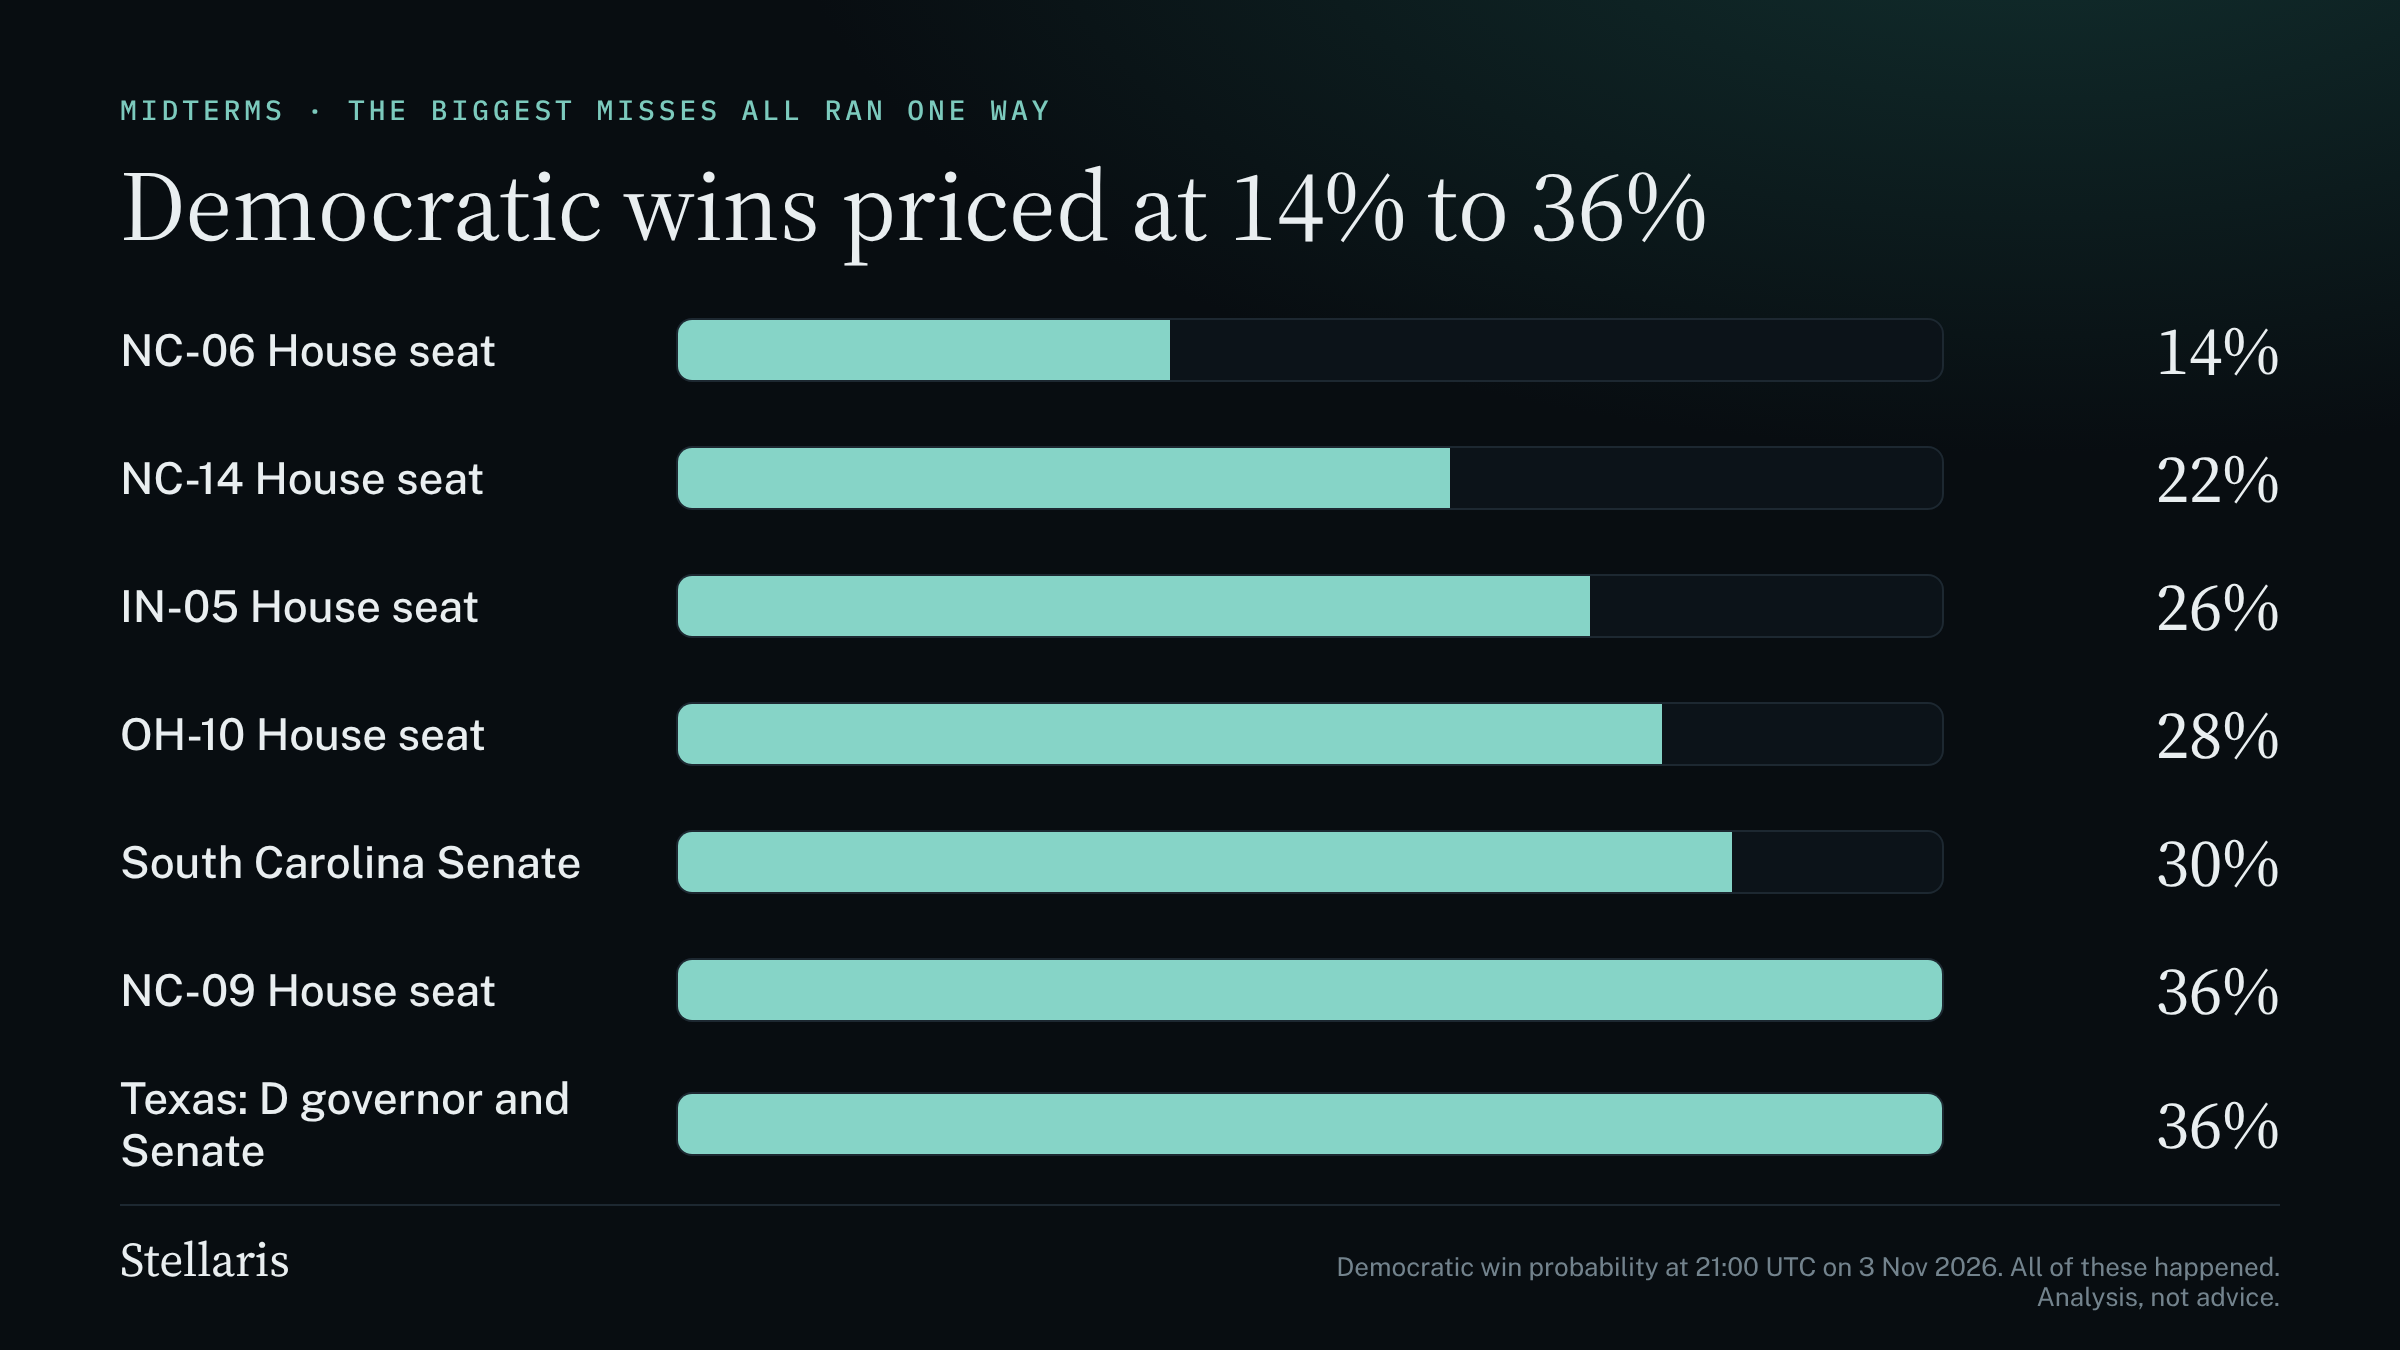
This is not 316 independent coin flips. A national swing moves every district at once, so one lopsided night produces a lopsided list of misses. The fair reading is that the markets underestimated the size of the swing, not that they were unlucky nine separate times.
Longshots overpriced, favourites underpriced
Group the 316 markets by their 4pm price and compare with how often they happened. The 60 priced at 10 to 30% happened 7% of the time. The 52 priced at 70 to 90% happened 96% of the time. Researchers call this the favourite-longshot bias: people overpay for long odds and underpay for near-certainties. It showed up here, on one night.
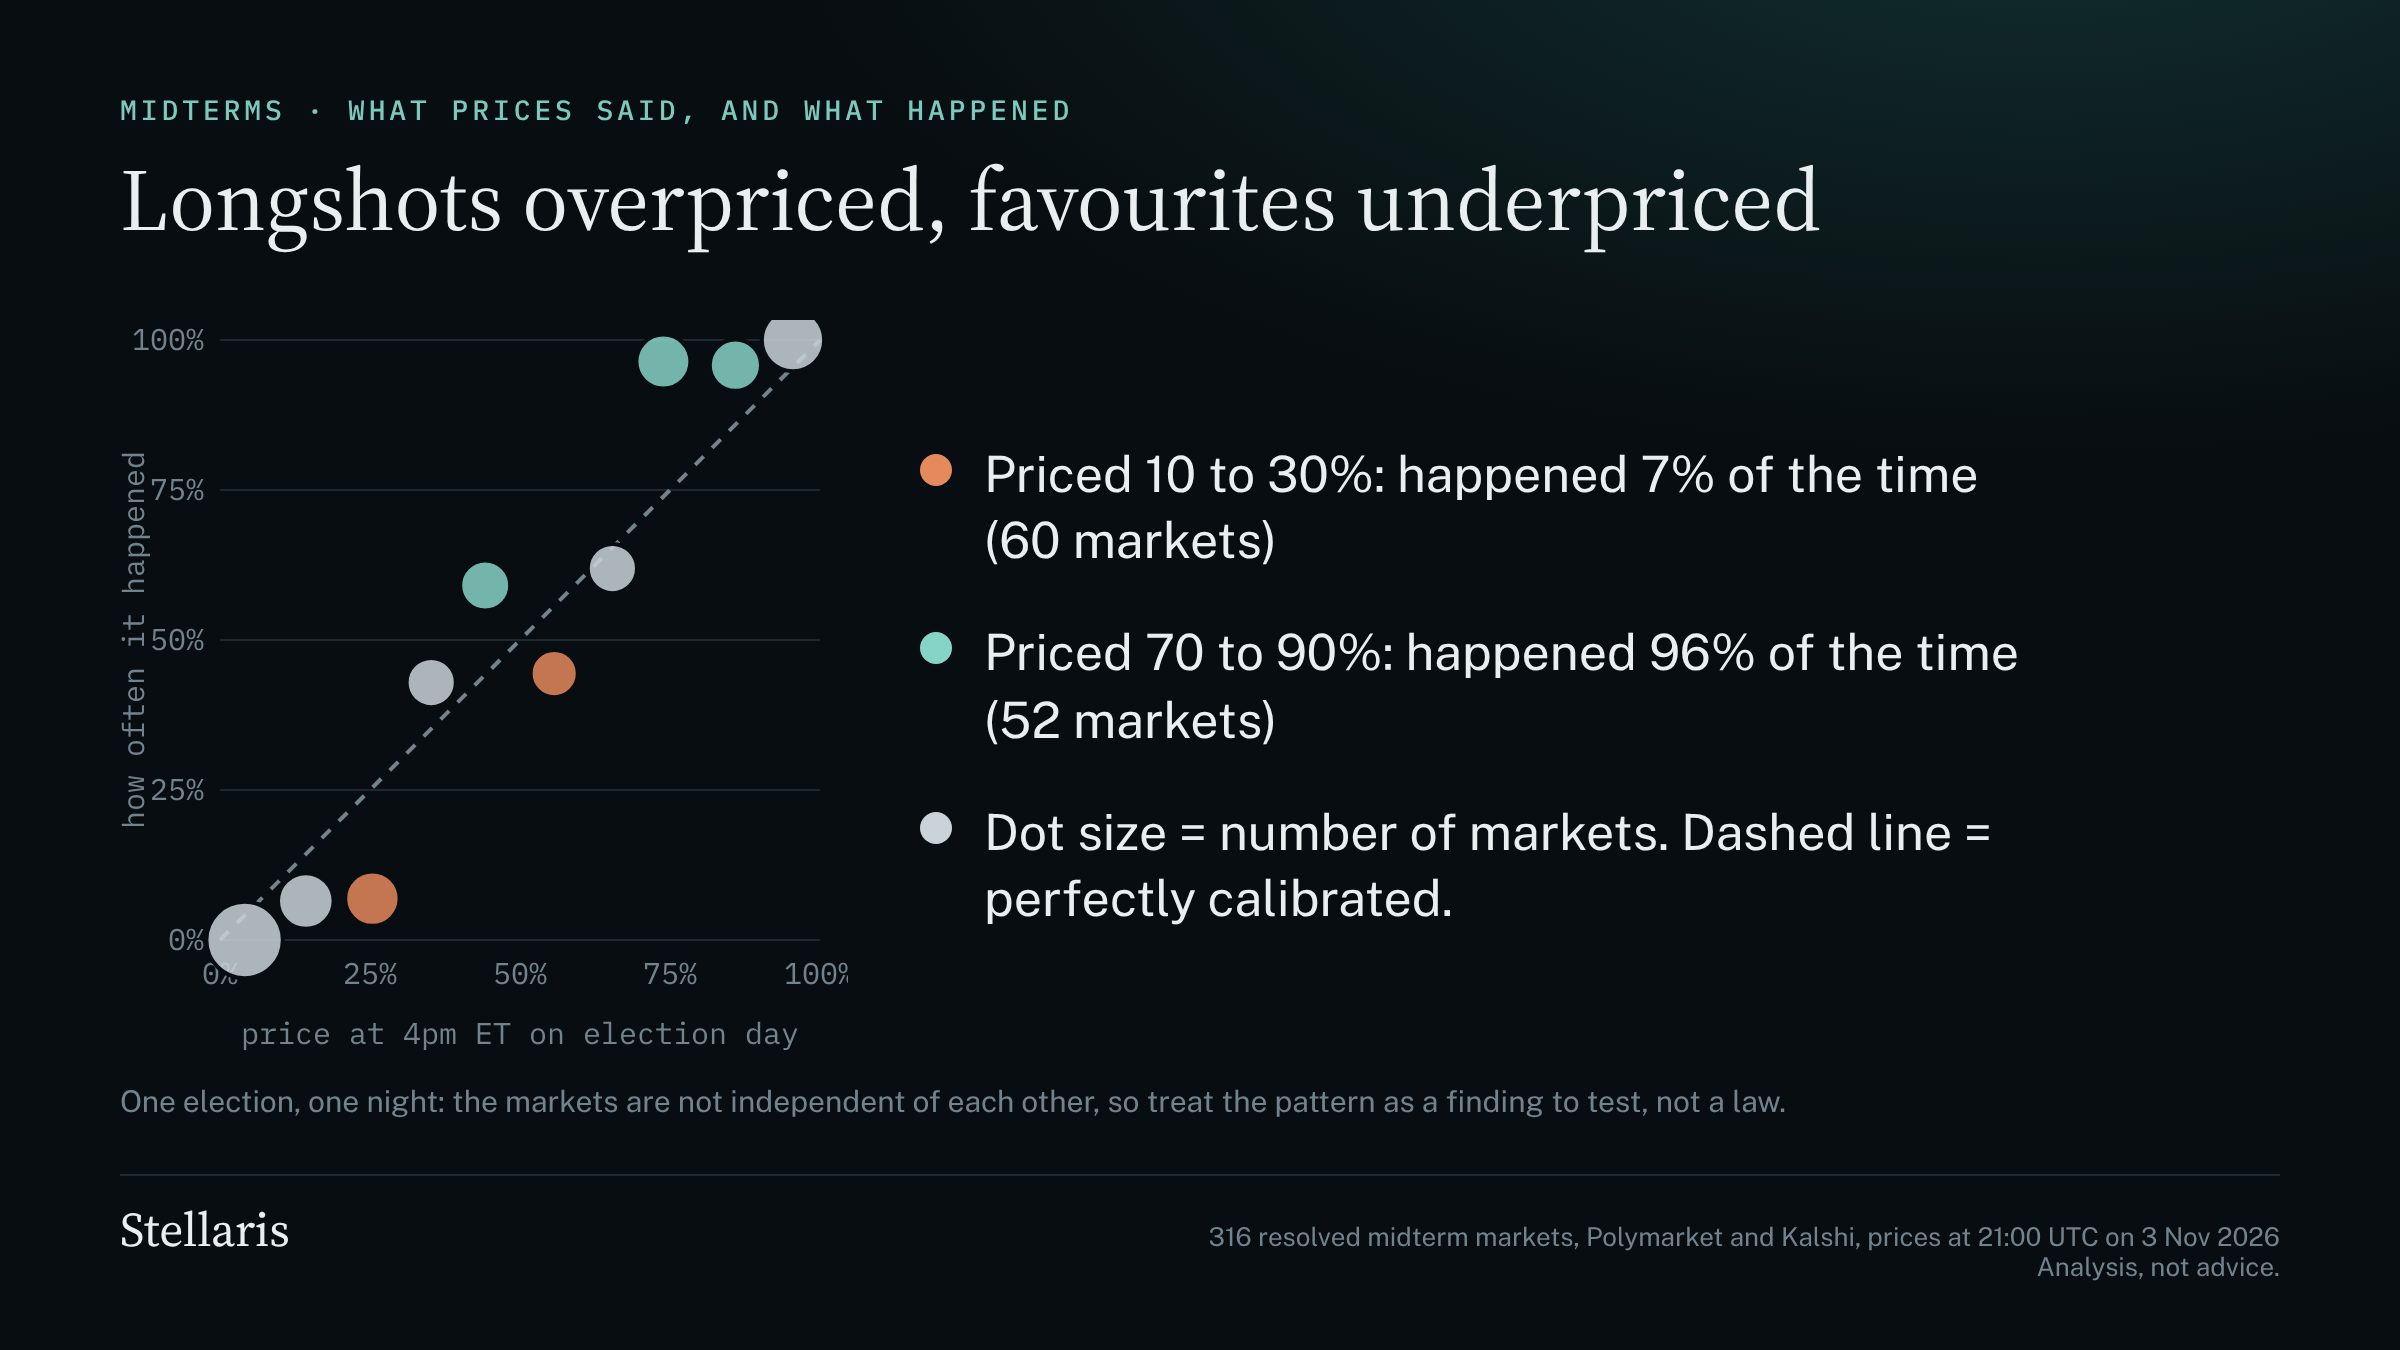
One election and strongly linked markets means the real sample is far smaller than 316. We treat this as a hypothesis to test on the next releases, not a finding to rely on.
On the night itself, the biggest moves were in the thinnest books
The same shape showed up in real time. Of the 25 largest 15-minute price moves on election night, 16 ended with fewer than 1,000 contracts near the price and only 4 had 10,000 or more. By contrast, the deep control markets were unmistakable: the two venues had the House at 99% Democratic by 8:00pm and 8:18pm Eastern, and the Senate by 9:02pm and 9:05pm. A big move in a thin book is weak evidence. A move in a deep book that both venues agree on is strong evidence.
The trust score's first real test: a mixed result
The Stellaris trust score runs from 0 to 100 and is meant to tell you how far to believe a price, built from checks on spread, depth, activity and who is trading, among others. This was its first test against real outcomes.
The 274 markets scoring 80 or higher had a Brier score of 0.094. The 42 below 80 scored 0.085. If anything, the lower-scoring group did slightly better. The gap is small and the two groups are very different mixes of races, so we are not claiming low scores are good. We are saying the score as a whole did not separate good calls from bad ones on this night.
The jobs report: where the market could not see, and where it moved in a minute
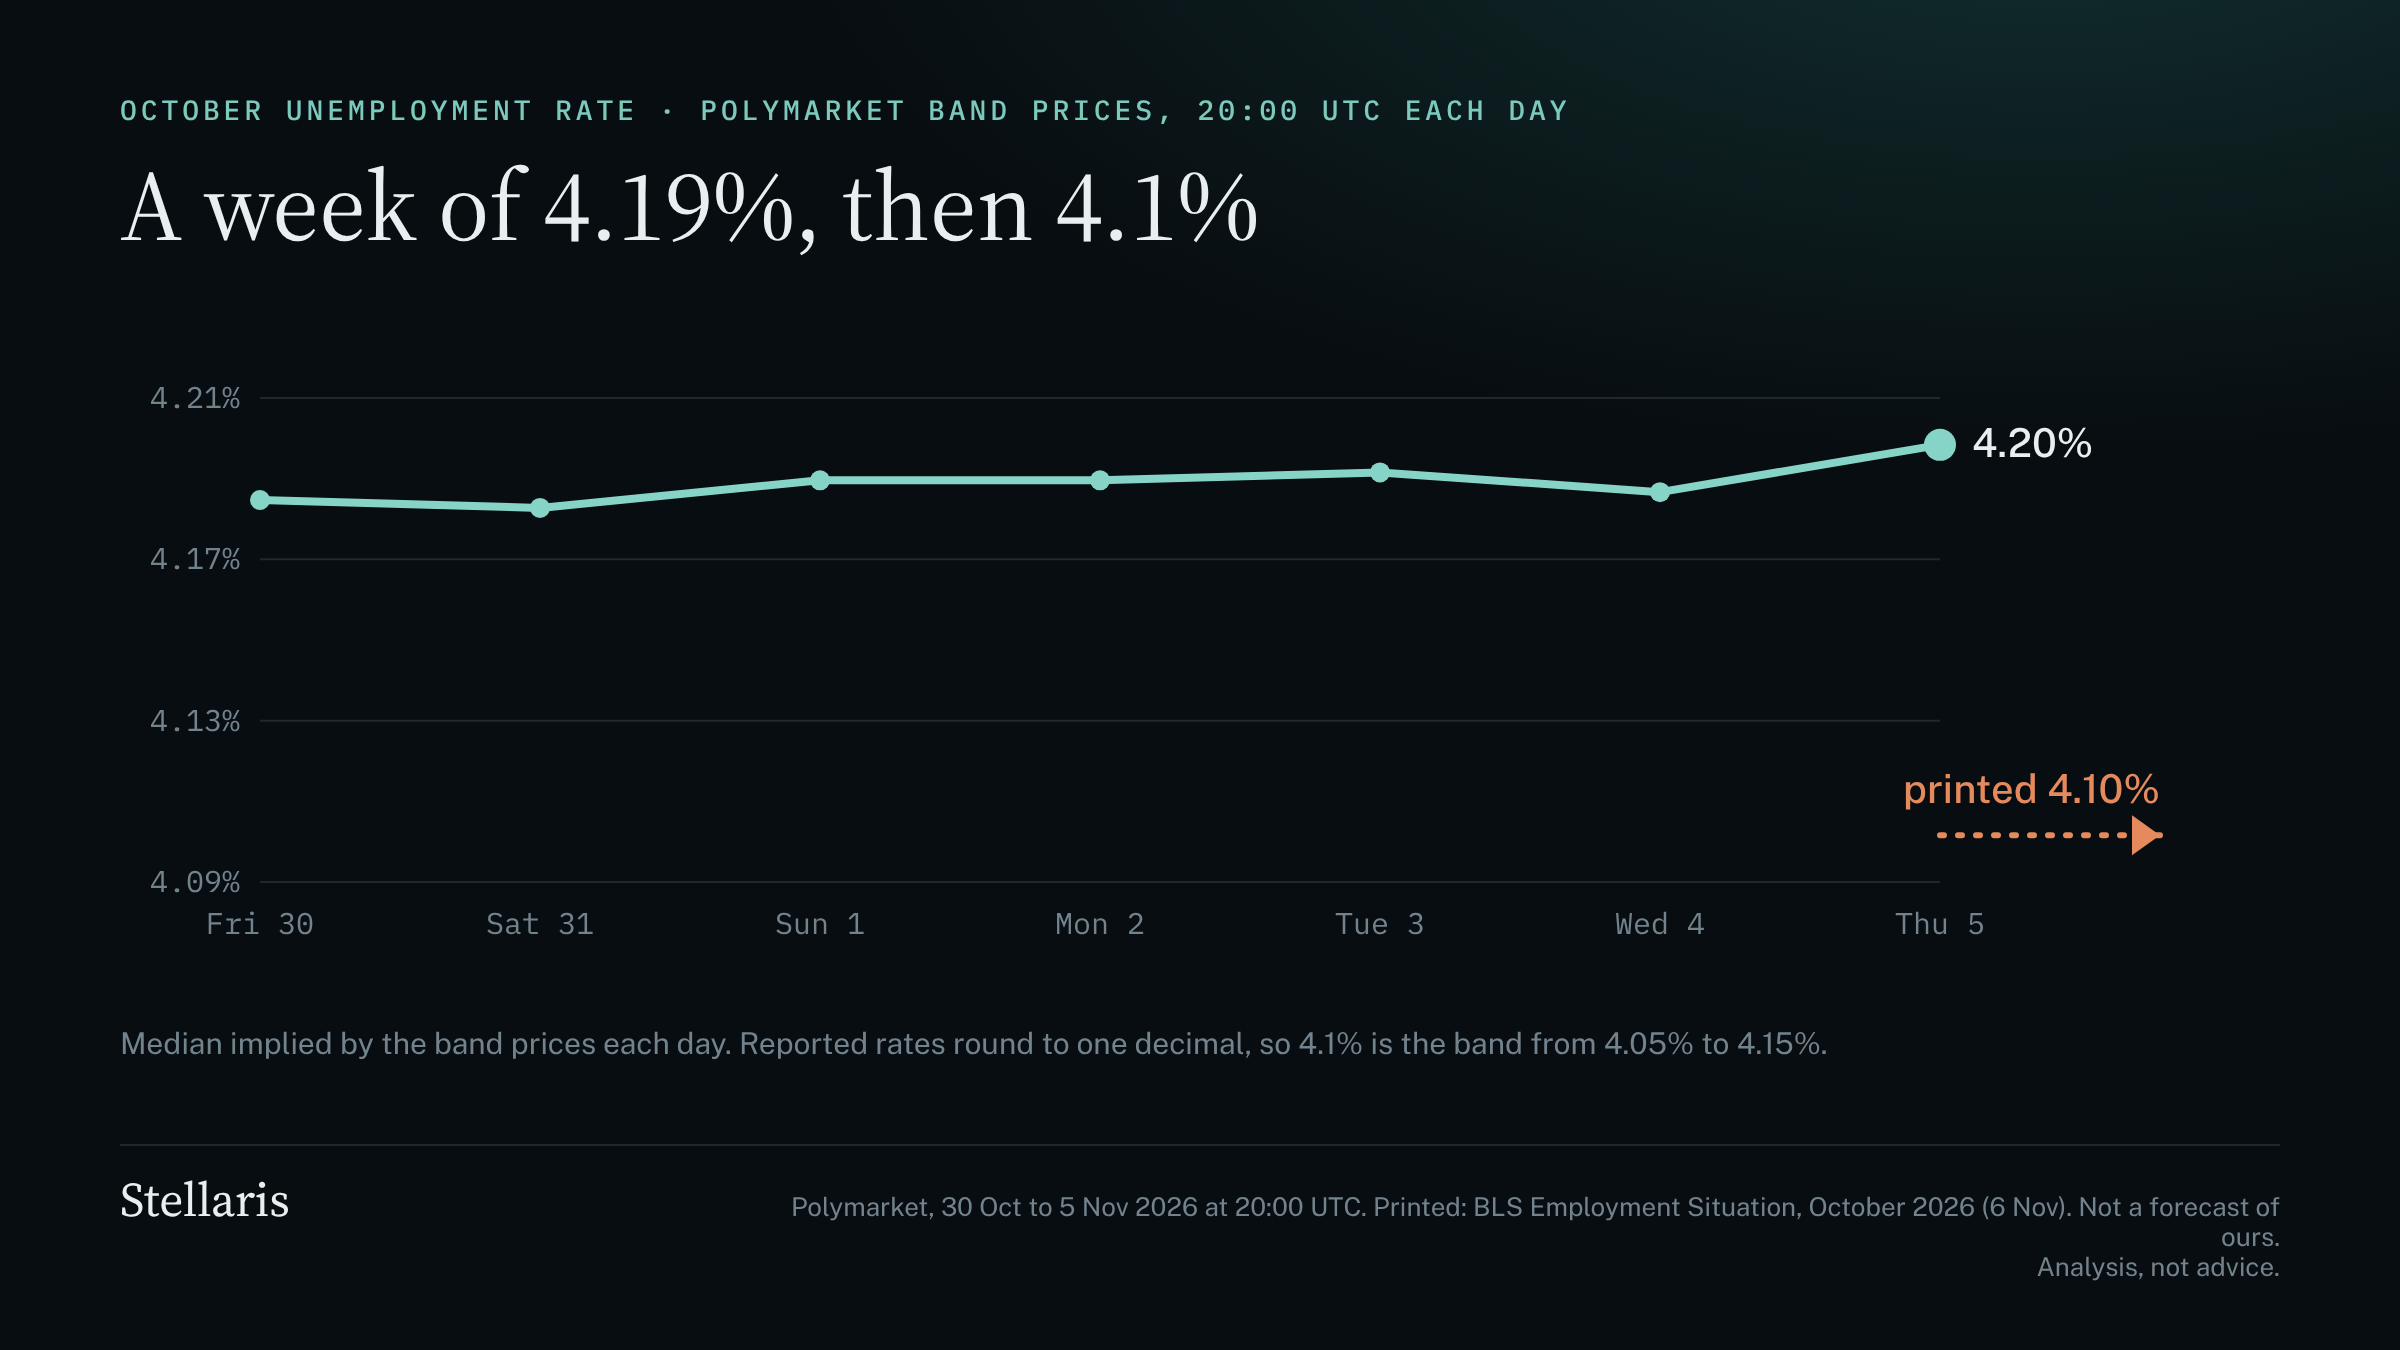
Unemployment. Polymarket's prices for October's unemployment rate implied a median of about 4.19% on every evening from 30 October to 5 November, with an 80% range of roughly 4.07% to 4.33% by Thursday. Kalshi's implied median was also 4.19%. The print was 4.1%. That is inside the range, at the low end: the market could see it, but it never moved toward it.
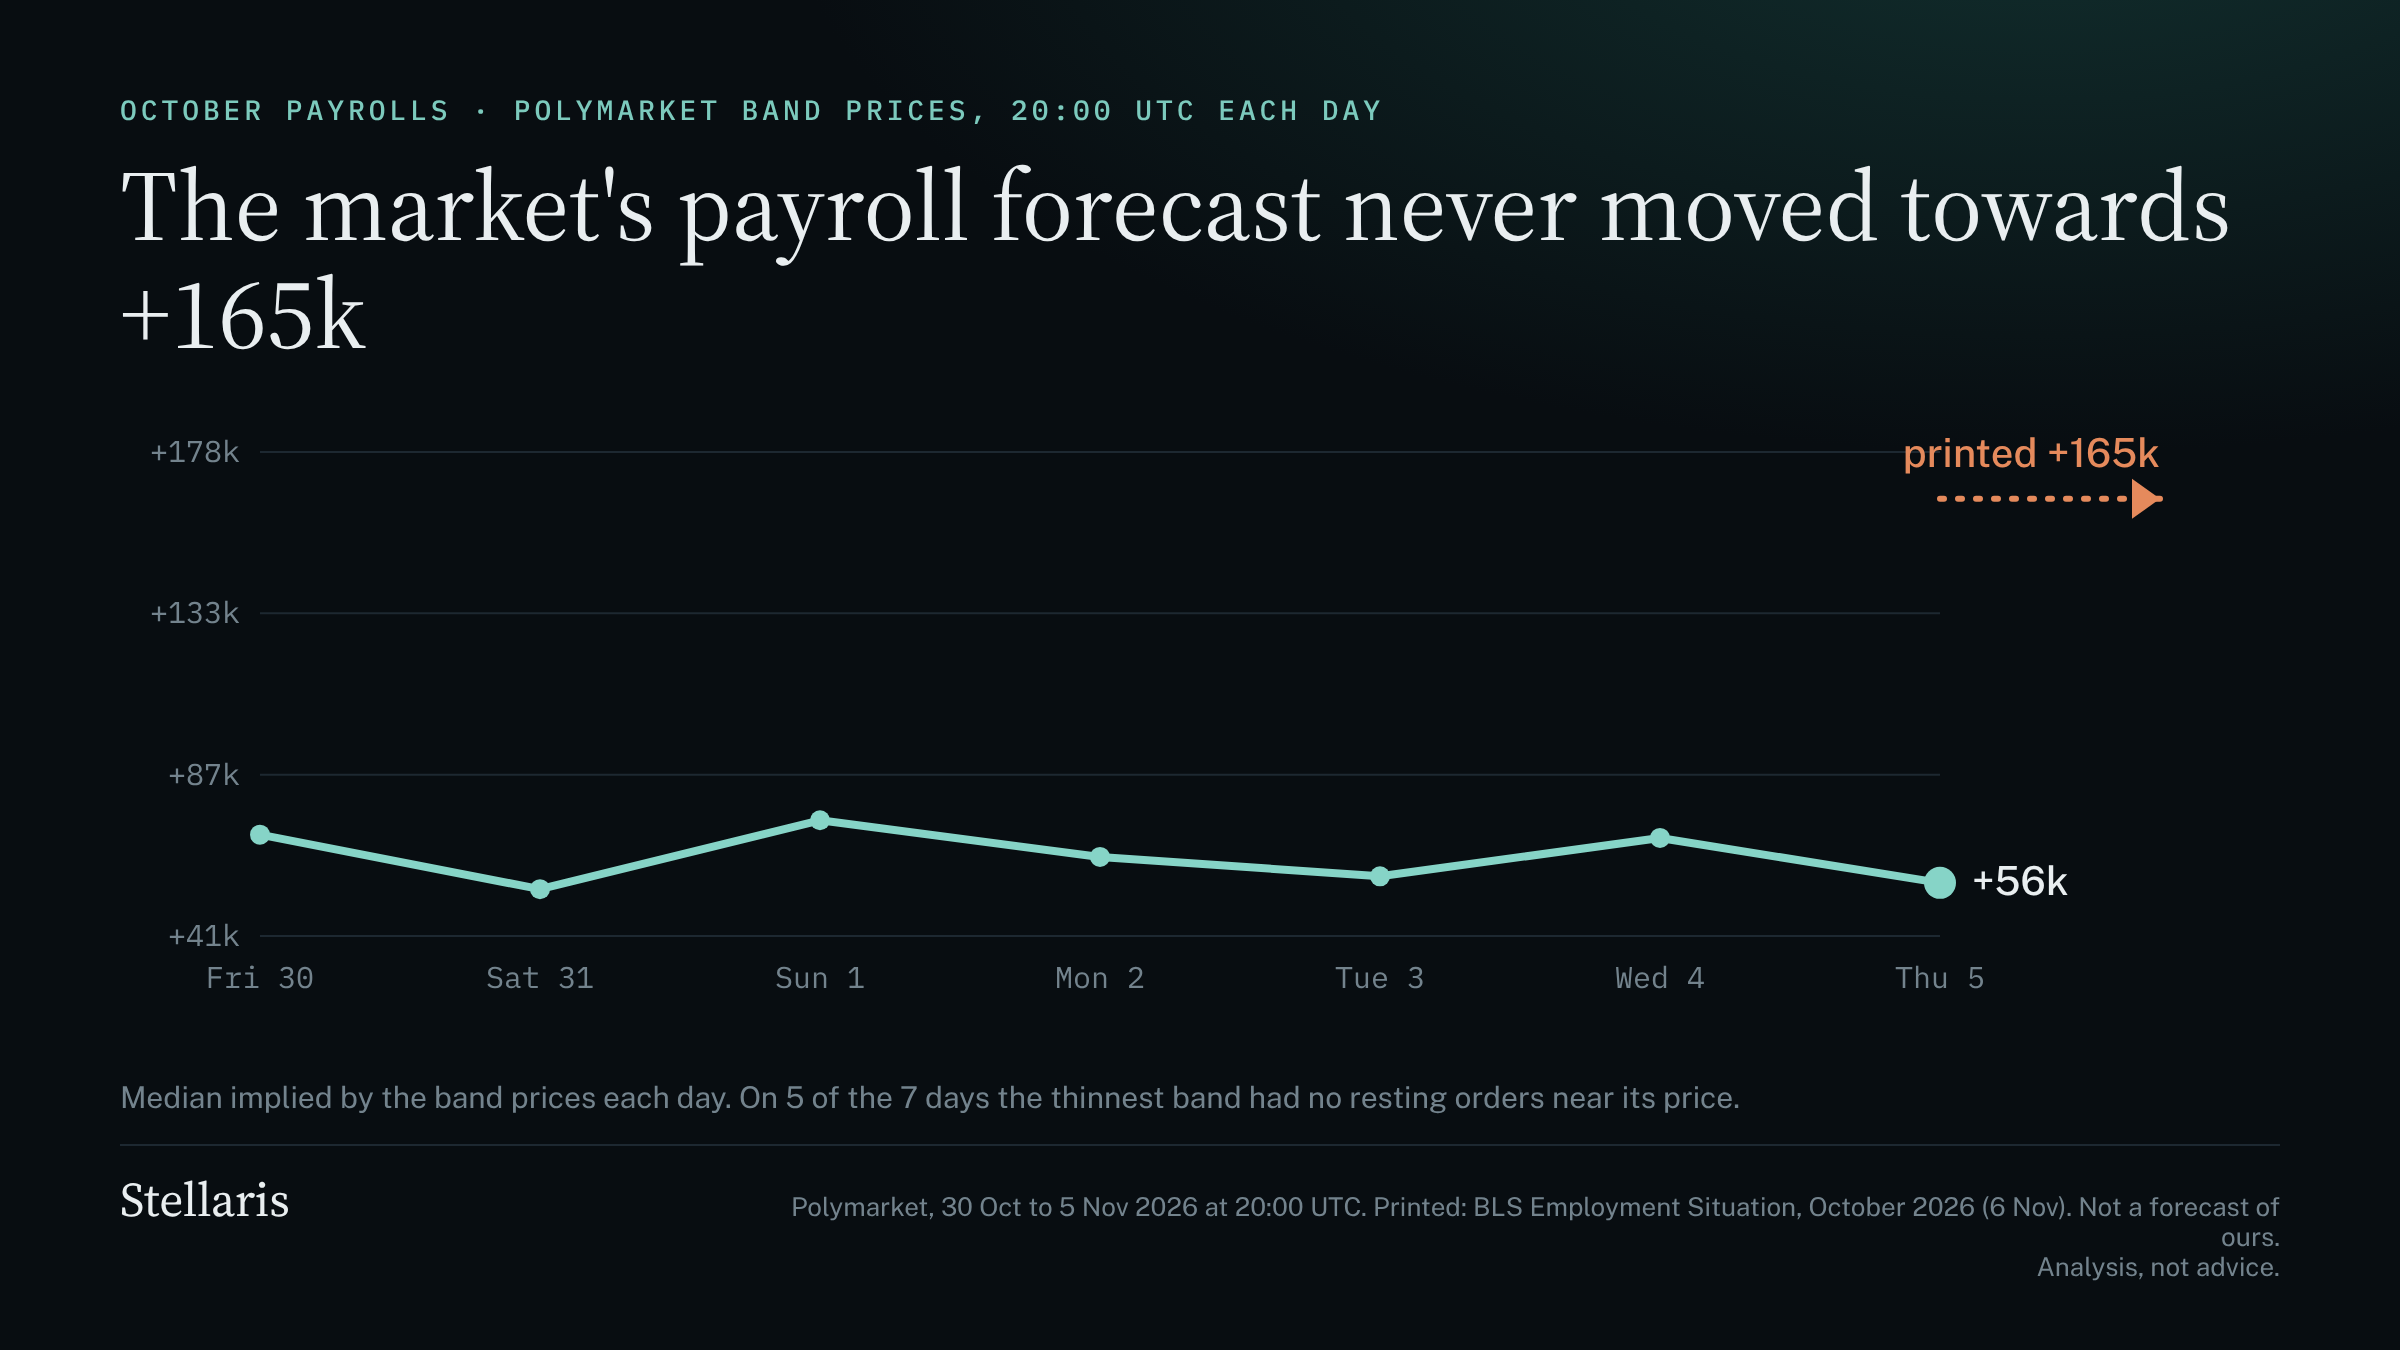
Payrolls. Polymarket's implied median for October payrolls was about 56,000 jobs on Thursday evening, and sat between 55,000 and 74,000 all week. The print was +165,000. The top band is open-ended ("100,000 or more"), so the upper end of the market's range cannot be read from the prices, and on five of the seven evenings the thinnest band had no resting orders at all. On Thursday morning (12:09 UTC) the 100,000-plus band was priced at 27.5%, with about 1,286 contracts behind it. The print landed in the tail the market was least able to describe, in a band it gave roughly a one-in-four chance.
Reaction time depends on depth
At 13:30 UTC the print landed and the Fed markets moved. Polymarket's December hike market went from 70% to 79%. Kalshi's went from 72% to 79%. In the deepest Polymarket markets, 90% of the move was done by the first one-minute snapshot after the release. All five Polymarket Fed markets with 10,000 or more contracts got there in one minute. The three with fewer than 4,000 contracts took 6, 21 and 27 minutes.
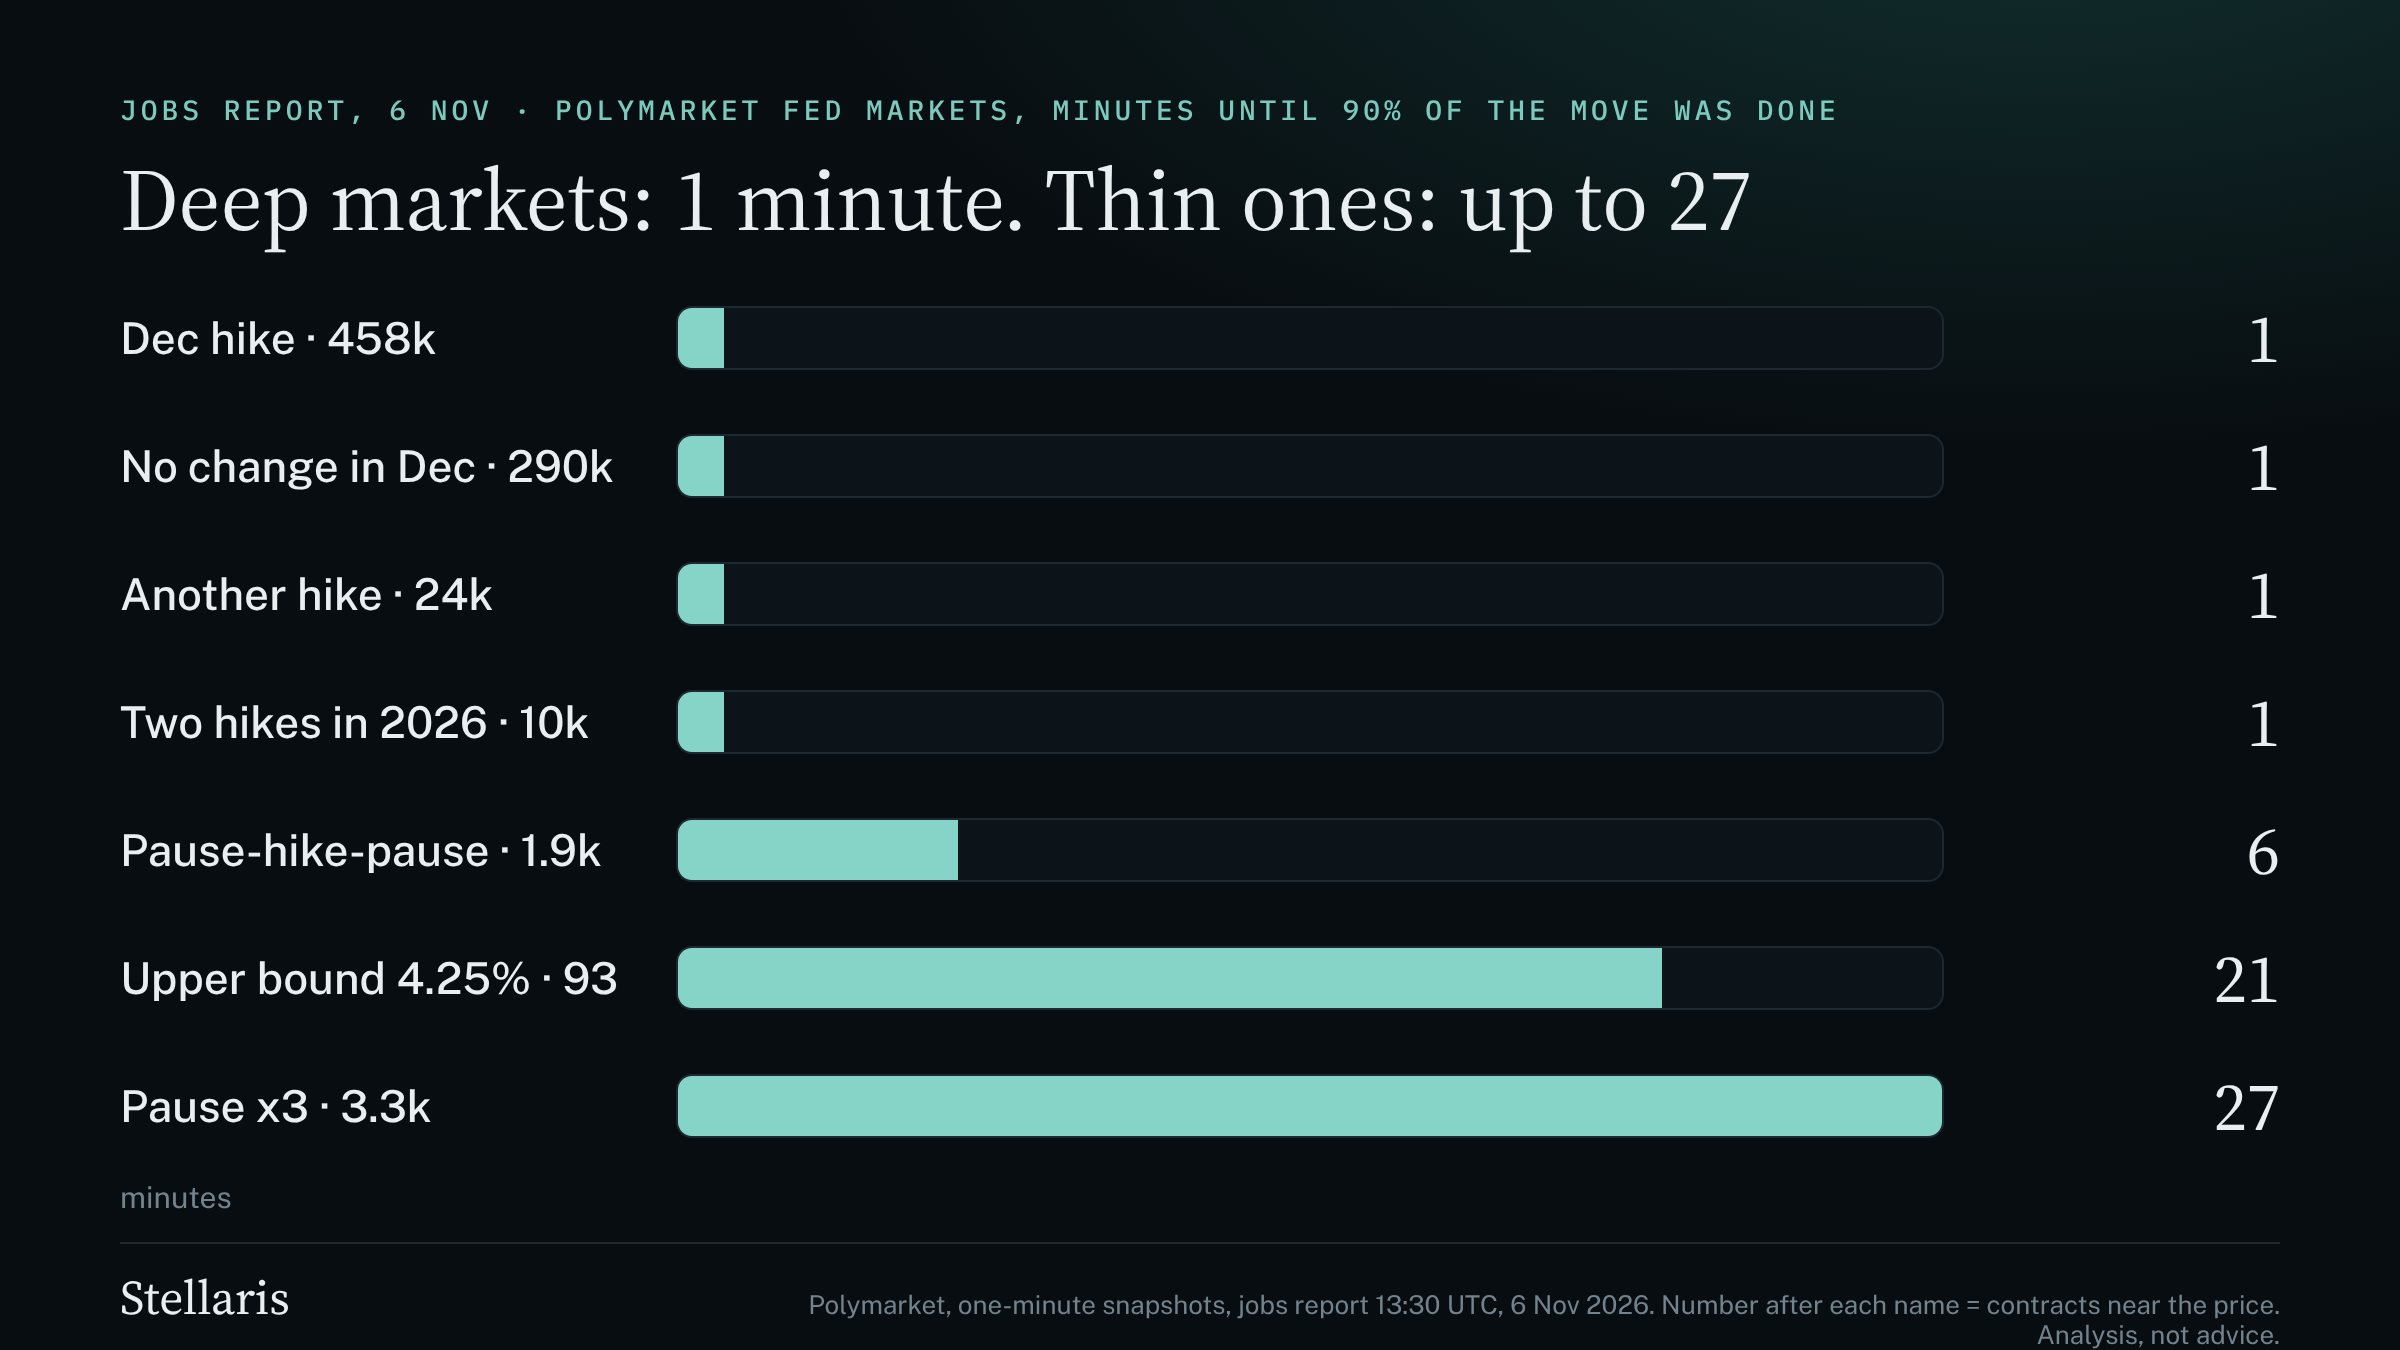
Kalshi was less tidy. Its median mover took 12.5 minutes to finish 90% of its move, and one Kalshi market with more than 100,000 contracts took 18. With 10 to 11 markets a venue, one print and one-minute snapshots, we do not read this as a verdict on either venue. We read it as a reason to check depth before trusting a fast move.
CPI on Tuesday: what the market has priced
October CPI is due Tuesday 10 November at 13:30 UK, 8:30 ET (check the BLS calendar for any change). Here is what our recordings imply as of Sunday afternoon.
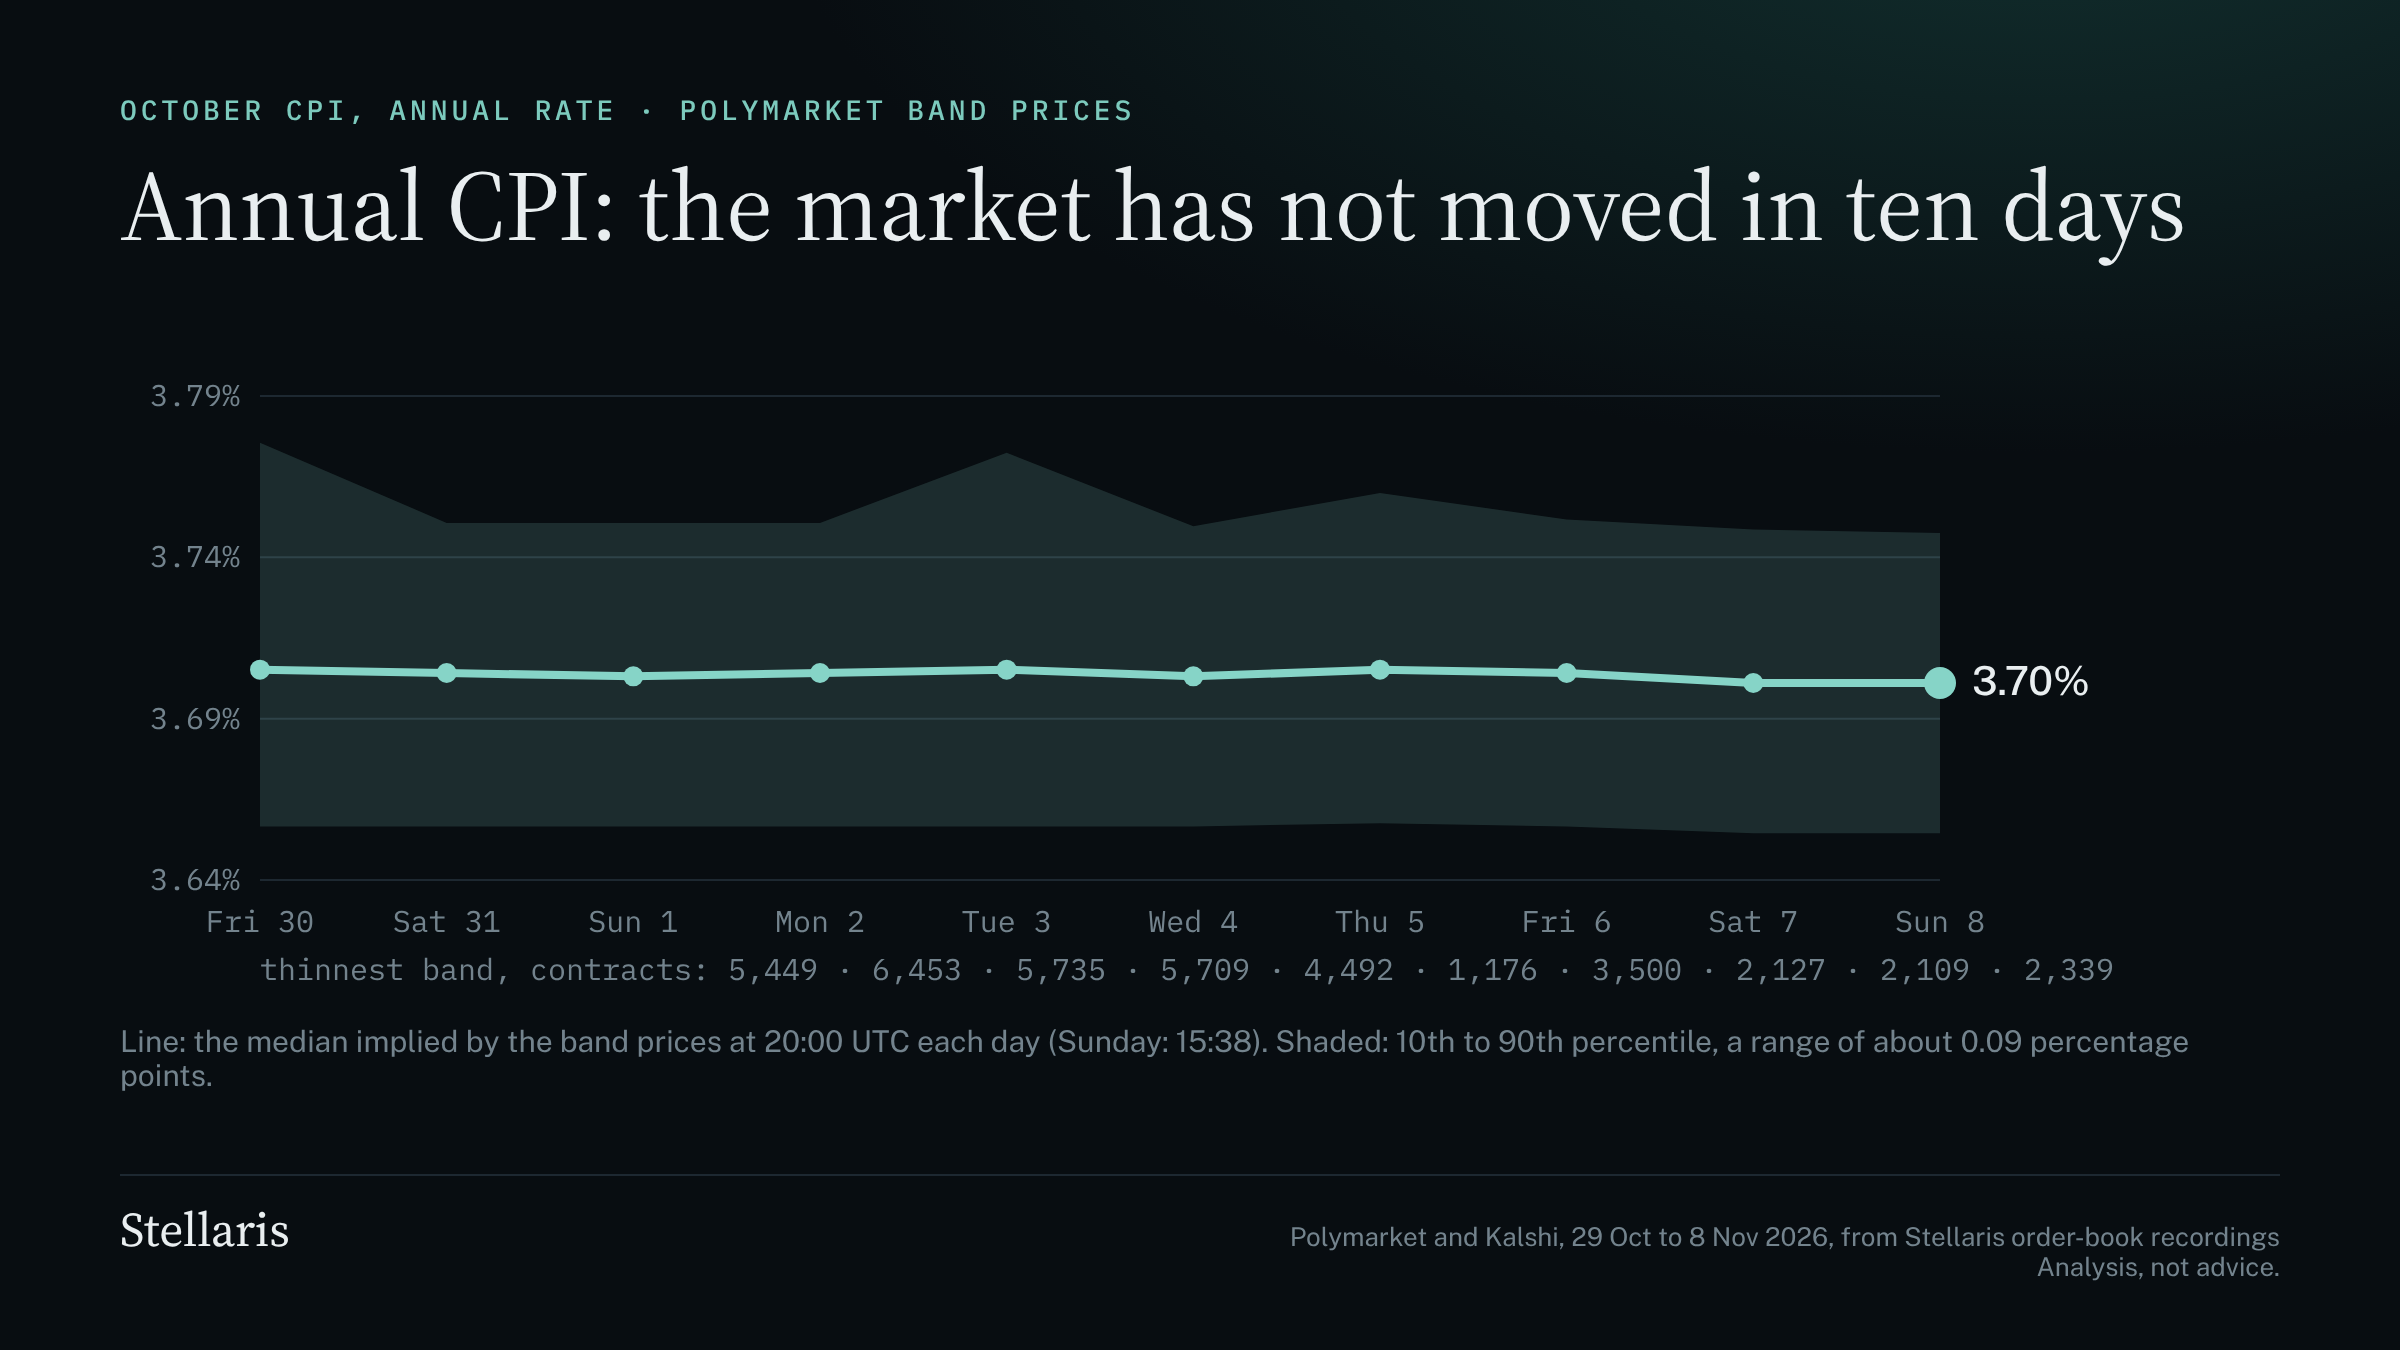
Annual rate. Polymarket's bands imply a median of 3.70%. It has been the same to within 0.004 points on each of the last ten evenings, with an 80% range of about 3.66% to 3.75%. The thinnest of the 12 bands held about 2,300 contracts on Sunday. In the individual bands, Polymarket gives 89% to exactly 3.7% and 4% each to 3.6% and 3.8% (trust score 74 for the 3.7% band). Core CPI, annual, sits at about 2.60%.
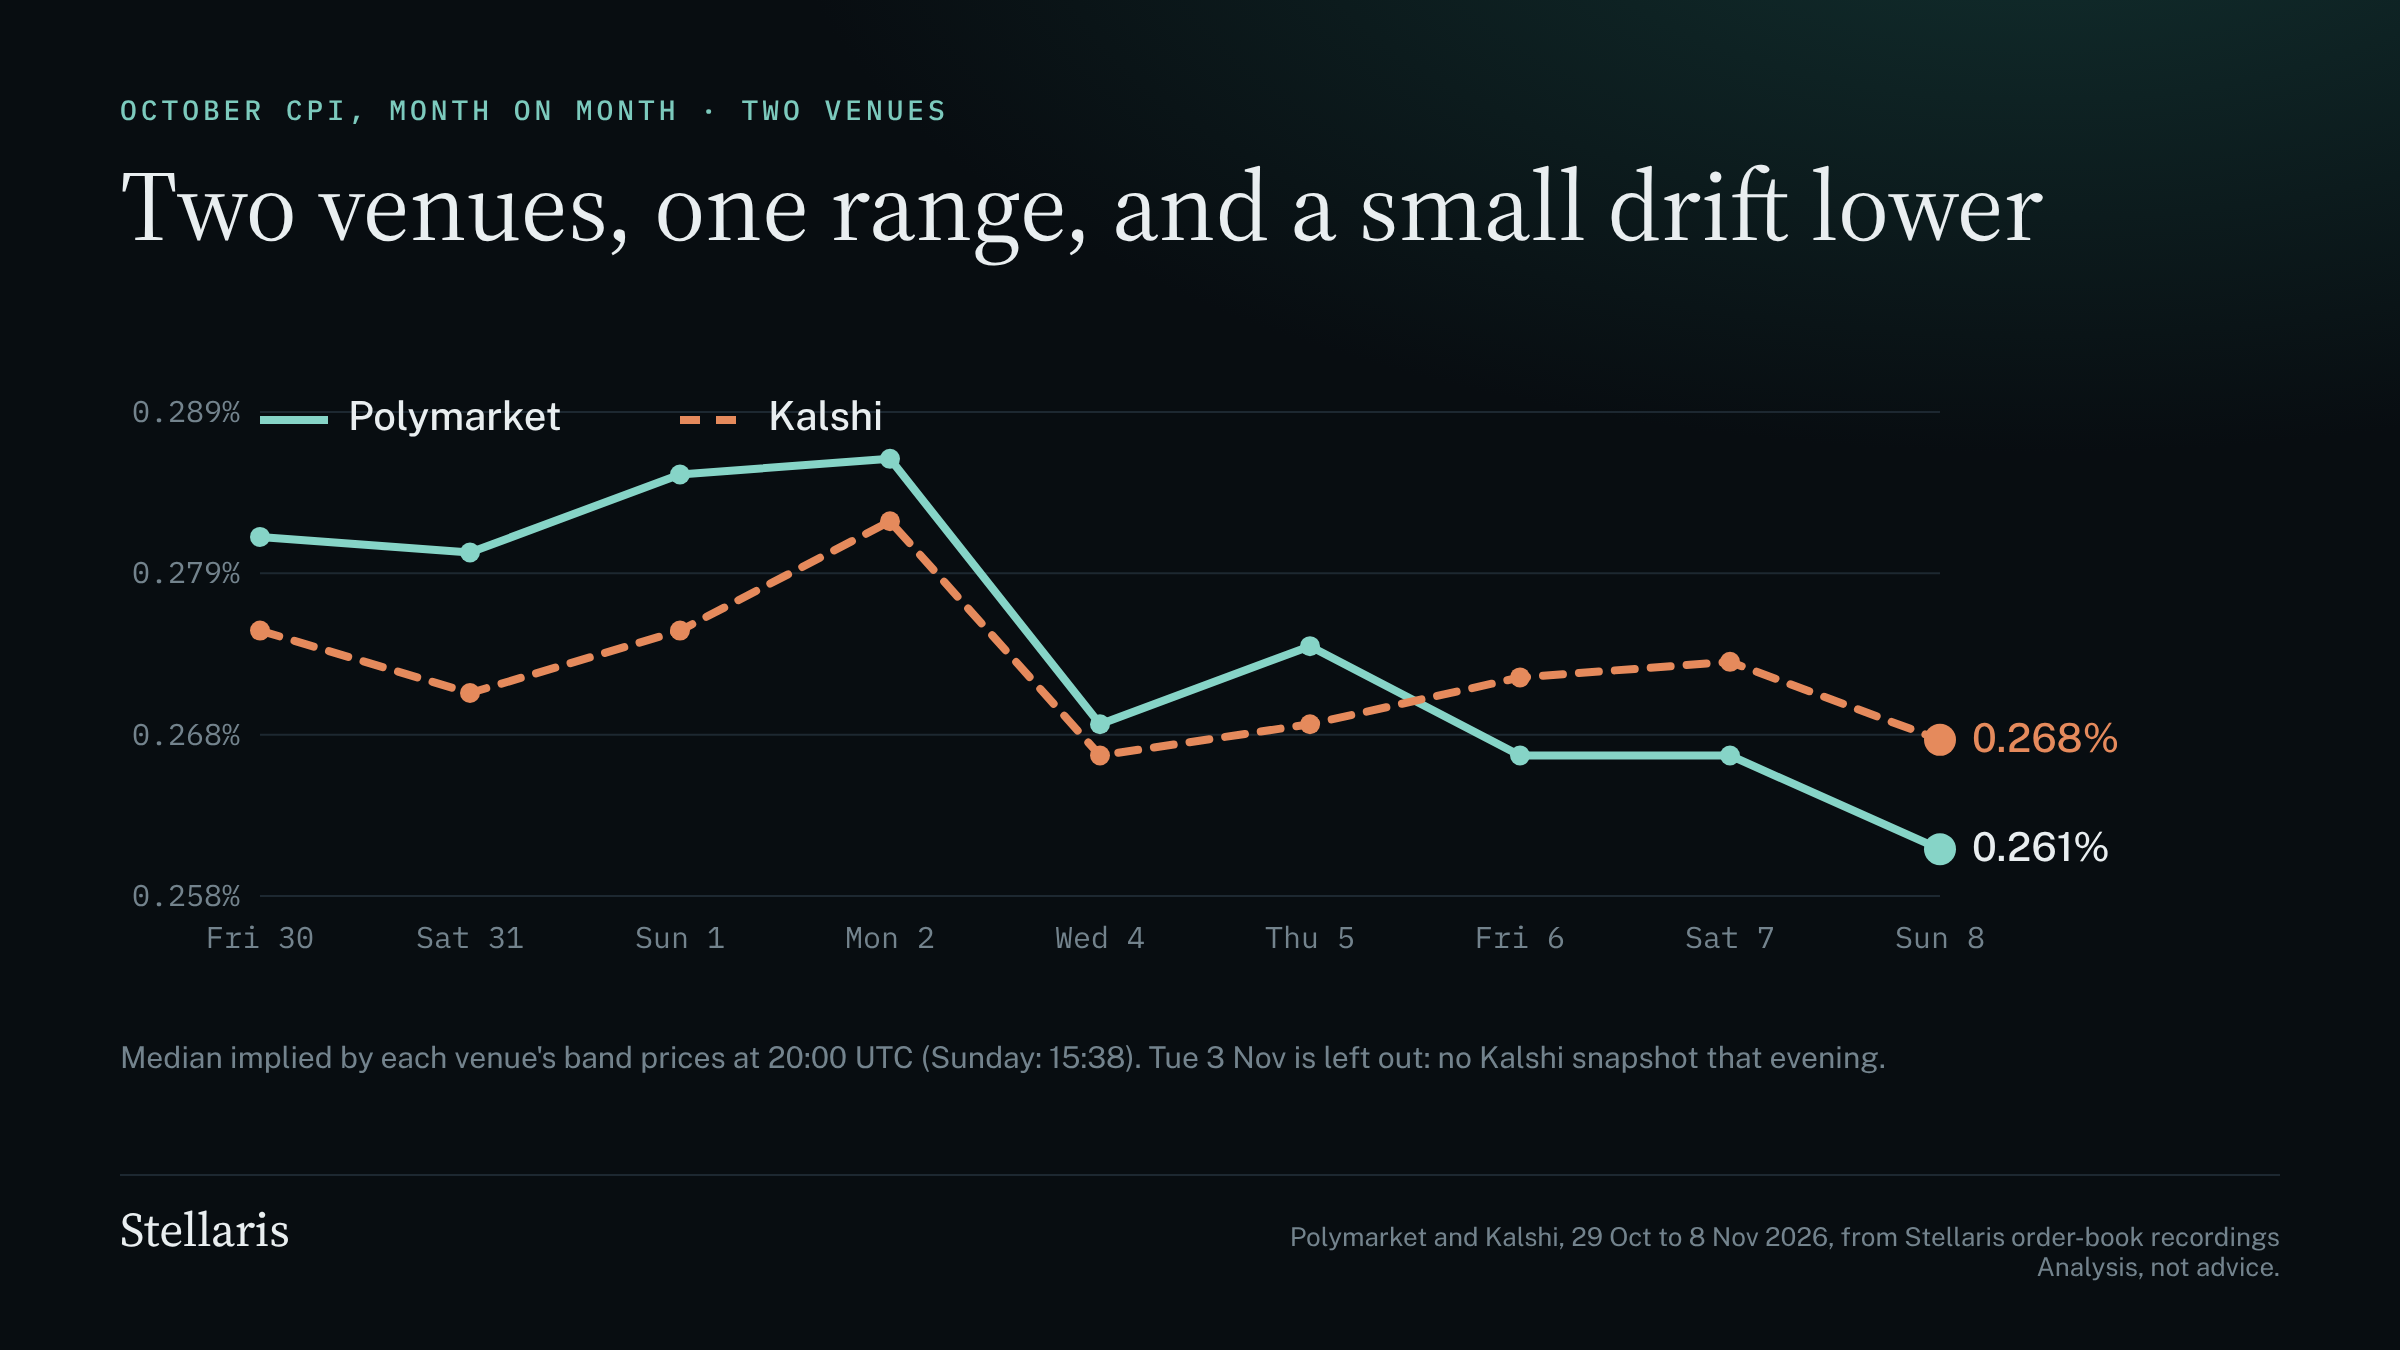
Month on month. The two venues agree closely: Polymarket implies a median of 0.26% and Kalshi 0.27%. Polymarket's has drifted down from 0.28% on 30 October. The 80% ranges are about 0.16% to 0.37% on Polymarket and 0.16% to 0.38% on Kalshi. The books are very different. The thinnest of Kalshi's four bands holds more than 23,000 contracts. The thinnest of Polymarket's nine holds about 660. For core month on month, Polymarket implies about 0.24% (range 0.15% to 0.35%), and Kalshi 0.23% as of Saturday. In the individual bands, Polymarket has 43% on 0.3% and 39% on 0.2% (up 4 points in 24 hours), 8% on 0.4% and 6% on 0.1% or less. Kalshi has 58% on a monthly rise above 0.2% and 15% above 0.3%. On core, Kalshi gives 40% to above 0.2% and 10% to above 0.3%.
What we expect to see, and what we would watch
These are expectations about how the markets will behave, not calls on the economy and not advice.
- The annual CPI market should be the calmest on the day. Ten days of an unmoving 3.70% says the market has made up its mind. We expect little repricing there unless the print breaks outside 3.66% to 3.75%, and a break would be a real surprise, not a thin-book wobble.
- The noise will be in the monthly and core bands. Polymarket's thinnest monthly band holds about 660 contracts. On the jobs print, books that thin took 6 to 27 minutes to finish moving. We expect the first minutes of CPI repricing to be messy and to settle in the deep Fed-rate markets first.
- If the two venues disagree on the monthly number for more than a few minutes, check which book is deeper before deciding which is right.
- We expect the favourite-longshot pattern from the midterms to be worth testing on CPI day. The lowest-priced bands in thin ladders are where we would look first for overpricing. That is a hypothesis, and we will report what the data says either way.
- On the Fed, the two venues agree to the point: as of Sunday midday both have a December hike at 76% and no change at 22%, with trust scores of 96 to 100. That is down from 79% right after the jobs report. Both also give 97 to 98% to no rate cuts at all in 2026. In our view Tuesday's CPI is the next data most likely to move the December number, and these deep Fed markets are where to watch it.
- A reminder from oil, which we are not making a call on: Polymarket's "will WTI hit $105 in November" sits at 34% with a trust score of only 43. Our earlier retrospective study found that "will it touch X by a date" markets overstated the chance of yes, most of all close to the deadline. The lesson is the one from this week: look at how much money is behind the price.
- Beyond Tuesday: the November jobs report (4 December), the FOMC decision (9 December) and November CPI (10 December) are the next scheduled tests. We will score our own calls on those in public.
Our scorecard
- Midterm brief, 3 November: Democrats at 96% to win the House (Polymarket), 78% for the Senate (Polymarket) and 74% to win both chambers (Kalshi). All three came true.
- Jobs report ranges: the market's range for unemployment contained the 4.1% print. The payrolls print fell inside the top, open-ended band. Two of two held, though the payrolls range was open at the top, so that was a weak test.
- Trust score: first test mixed, as above. Depth worked. The composite did not.
- Every probability in this week's brief (44 calls, both venues) is recorded in our append-only track-record ledger, so it can be scored against the outcome later.
The five trust levels
Each market gets a score from 0 to 100 for how much weight its price deserves, from spread, depth, staleness, trader concentration, wash-trading patterns and turnover. How the score works · Guide: what a trust score is, and what it can't tell you.
What to keep in mind
- Midterm results: 316 resolved markets as of 8 November (Polymarket 218, Kalshi 98), scored from prices recorded at 21:00 UTC on 3 November. Depth is contracts resting within 5 cents of the price.
- Markets within one election are not independent of each other, and the thinnest depth group is only 11 markets. Treat the patterns as hypotheses to test, not as laws.
- Implied medians and ranges for the jobs and CPI ladders are our calculation from band prices. Open-ended bands are closed at their neighbour's width for the maths, and ranges inside an open tail are not reported.
- Snapshots are one minute apart, so "one minute" means by the first snapshot after the release. Kalshi trust scores use fewer checks than Polymarket's and are not directly comparable.
- Analysis of public market data, not investment advice. Stellaris is a trading name of Lumen Labs Limited.
This is analysis of public market data, not investment advice or a recommendation to trade. Stellaris is not a trading venue, broker or adviser and does not trade. Prices are those shown by the venues at the times stated and can change. Trust levels come from our published method and have known limits.